8.1 Topics Covered
- Illustrate the curse of dimensionality
- Interpreting a bubble chart
- Interpreting and manipulating a 3D scatter plot
- Interpreting and manipulating conditional plots
- Interpreting a parallel coordinate plot
- Explore > Bubble Chart
- bubble chart classification schemes
- bubble size
- Explore > 3D Scatter Plot
- rotating and zooming the 3D scatter plot
- projecting onto one axis
- selection in the 3D scatter plot
- Explore > Conditional Plot
- conditional scatter plot
- conditional histogram
- conditional box plot
- conditional map
- conditional plot option
- changing the condition breakpoints
- Explore > Parallel Coordinate Plot
- changing the classification theme for the PCP
- changing the order of the axes
- brushing the PCP
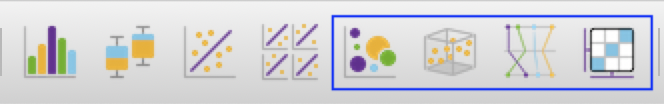
Figure 8.1: Bubble Chart | 3D Scatter Plot | Parallel Coordinate Plot | Conditional Plot