5.4 Cartogram
5.4.1 Principle
A cartogram is a map type where the original layout of the areal unit is replaced by a regular geometric shape (usually a circle, rectangle, or hexagon) that is proportional to the value of the variable for the location. This is in contrast to a standard choropleth map, where the size of the polygon corresponds to the area of the location in question. The cartogram has a long history and many variants have been suggested, some quite creative (see Dorling 1996; Tobler 2004, for an extensive discussion of various aspects of the cartogram). In essence, the construction of a cartogram is an example of a nonlinear optimization problem, where the geometric forms have to be located such that they reflect the topology (spatial arrangement) of the locations as closely as possible.
GeoDa implements a circular cartogram, in which the areal units are represented as circles,
whose size (and color) is proportional to the value observed at that location.
The changed shapes remove the misleading effect that the area of the unit might have on perception of magnitude.
5.4.2 Creating a cartogram
The cartogram is created from the main menu, as Map > Cartogram, or by selecting the second item in the toolbar shown in Figure 4.1.
This brings up a dialog to specify the Cartogram Variables, both for the Circle Size and the Circle Color. In most applications, those should be the same variable. In the example shown in Figure 5.9, the variable used is again the housing index.
The default is a Box Map classification for the circle colors (with hinge at 1.5 IQR).
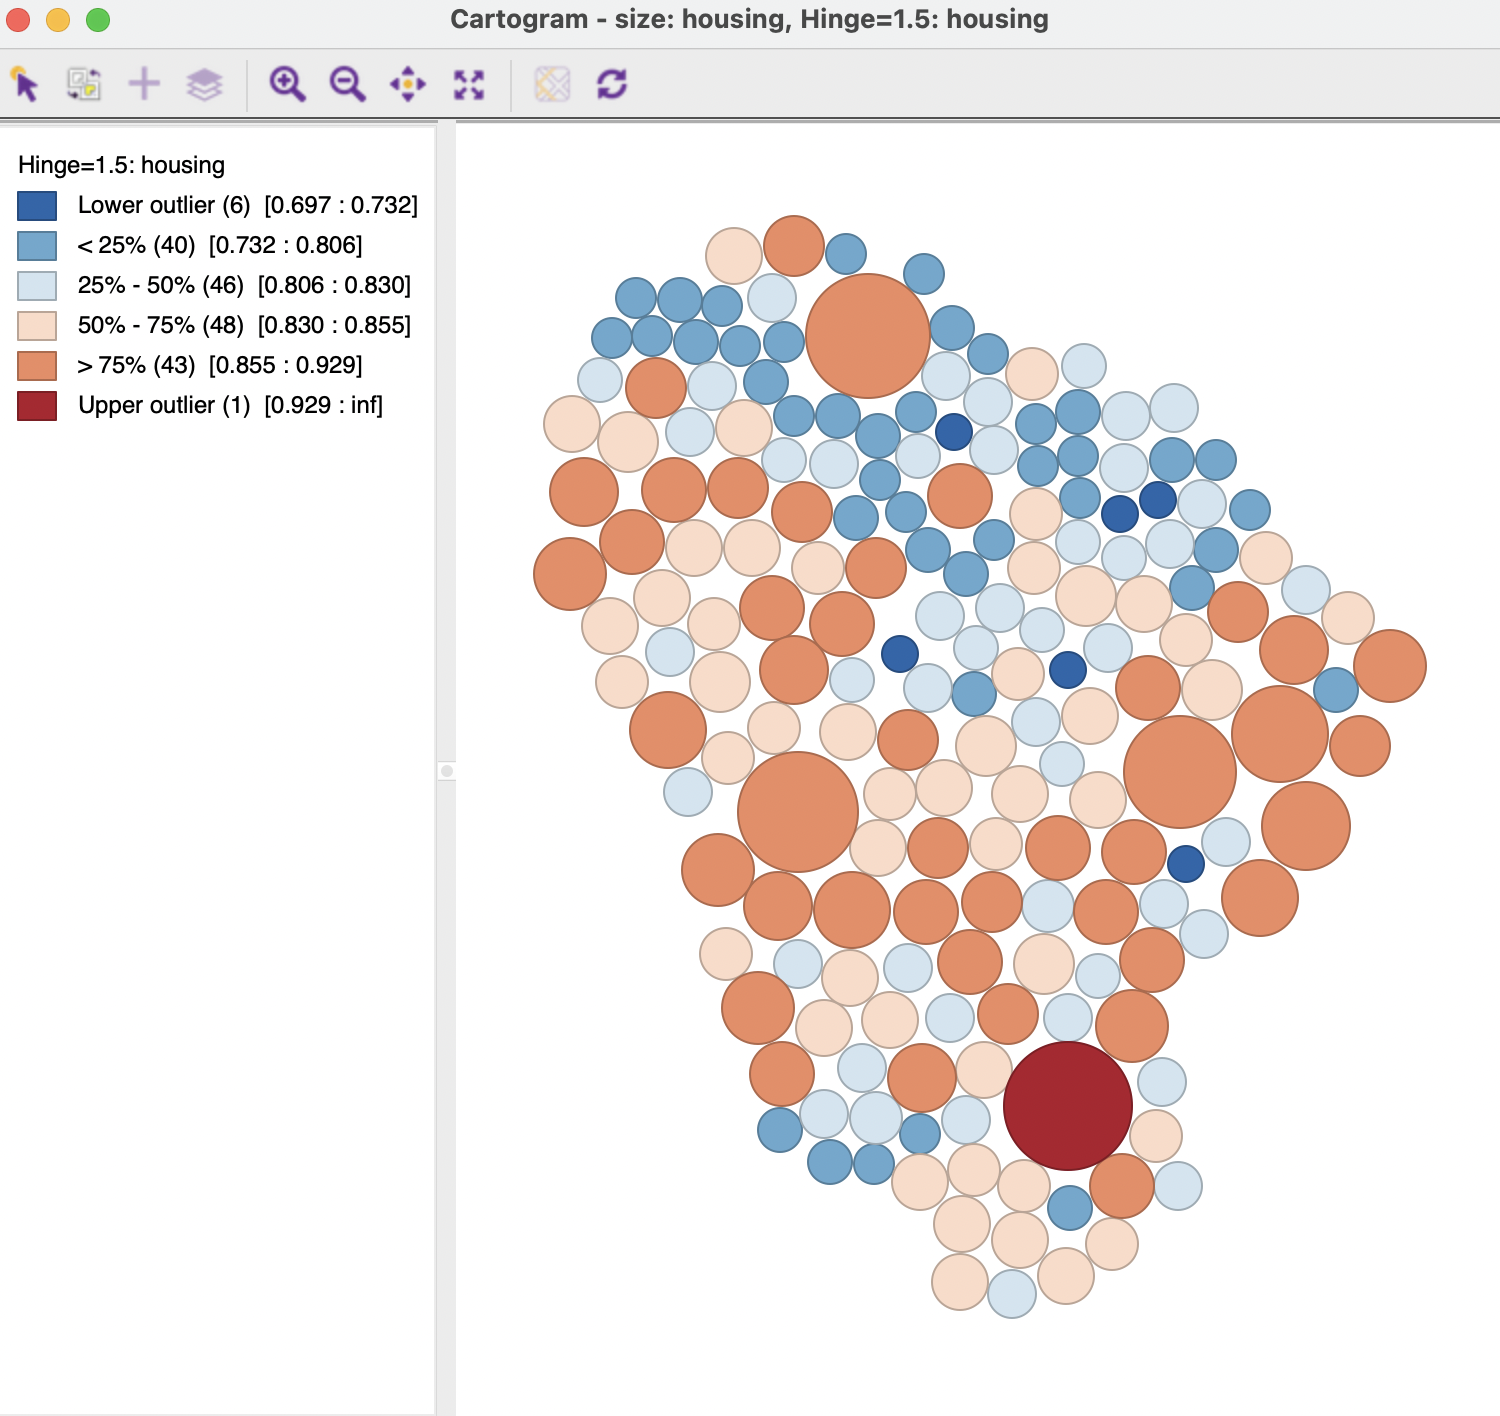
Figure 5.9: Cartogram
The cartogram is most insightful when used in conjunction with a regular choropleth map. Selecting an observation in the cartogram then immediately links it with the corresponding area in the choropleth map. In Figure 5.10, this identifies an observation in the upper quartile as a tiny municipio in the south-east of the state. Note how the location of the observation in the cartogram is not identical to that in the thematic map.
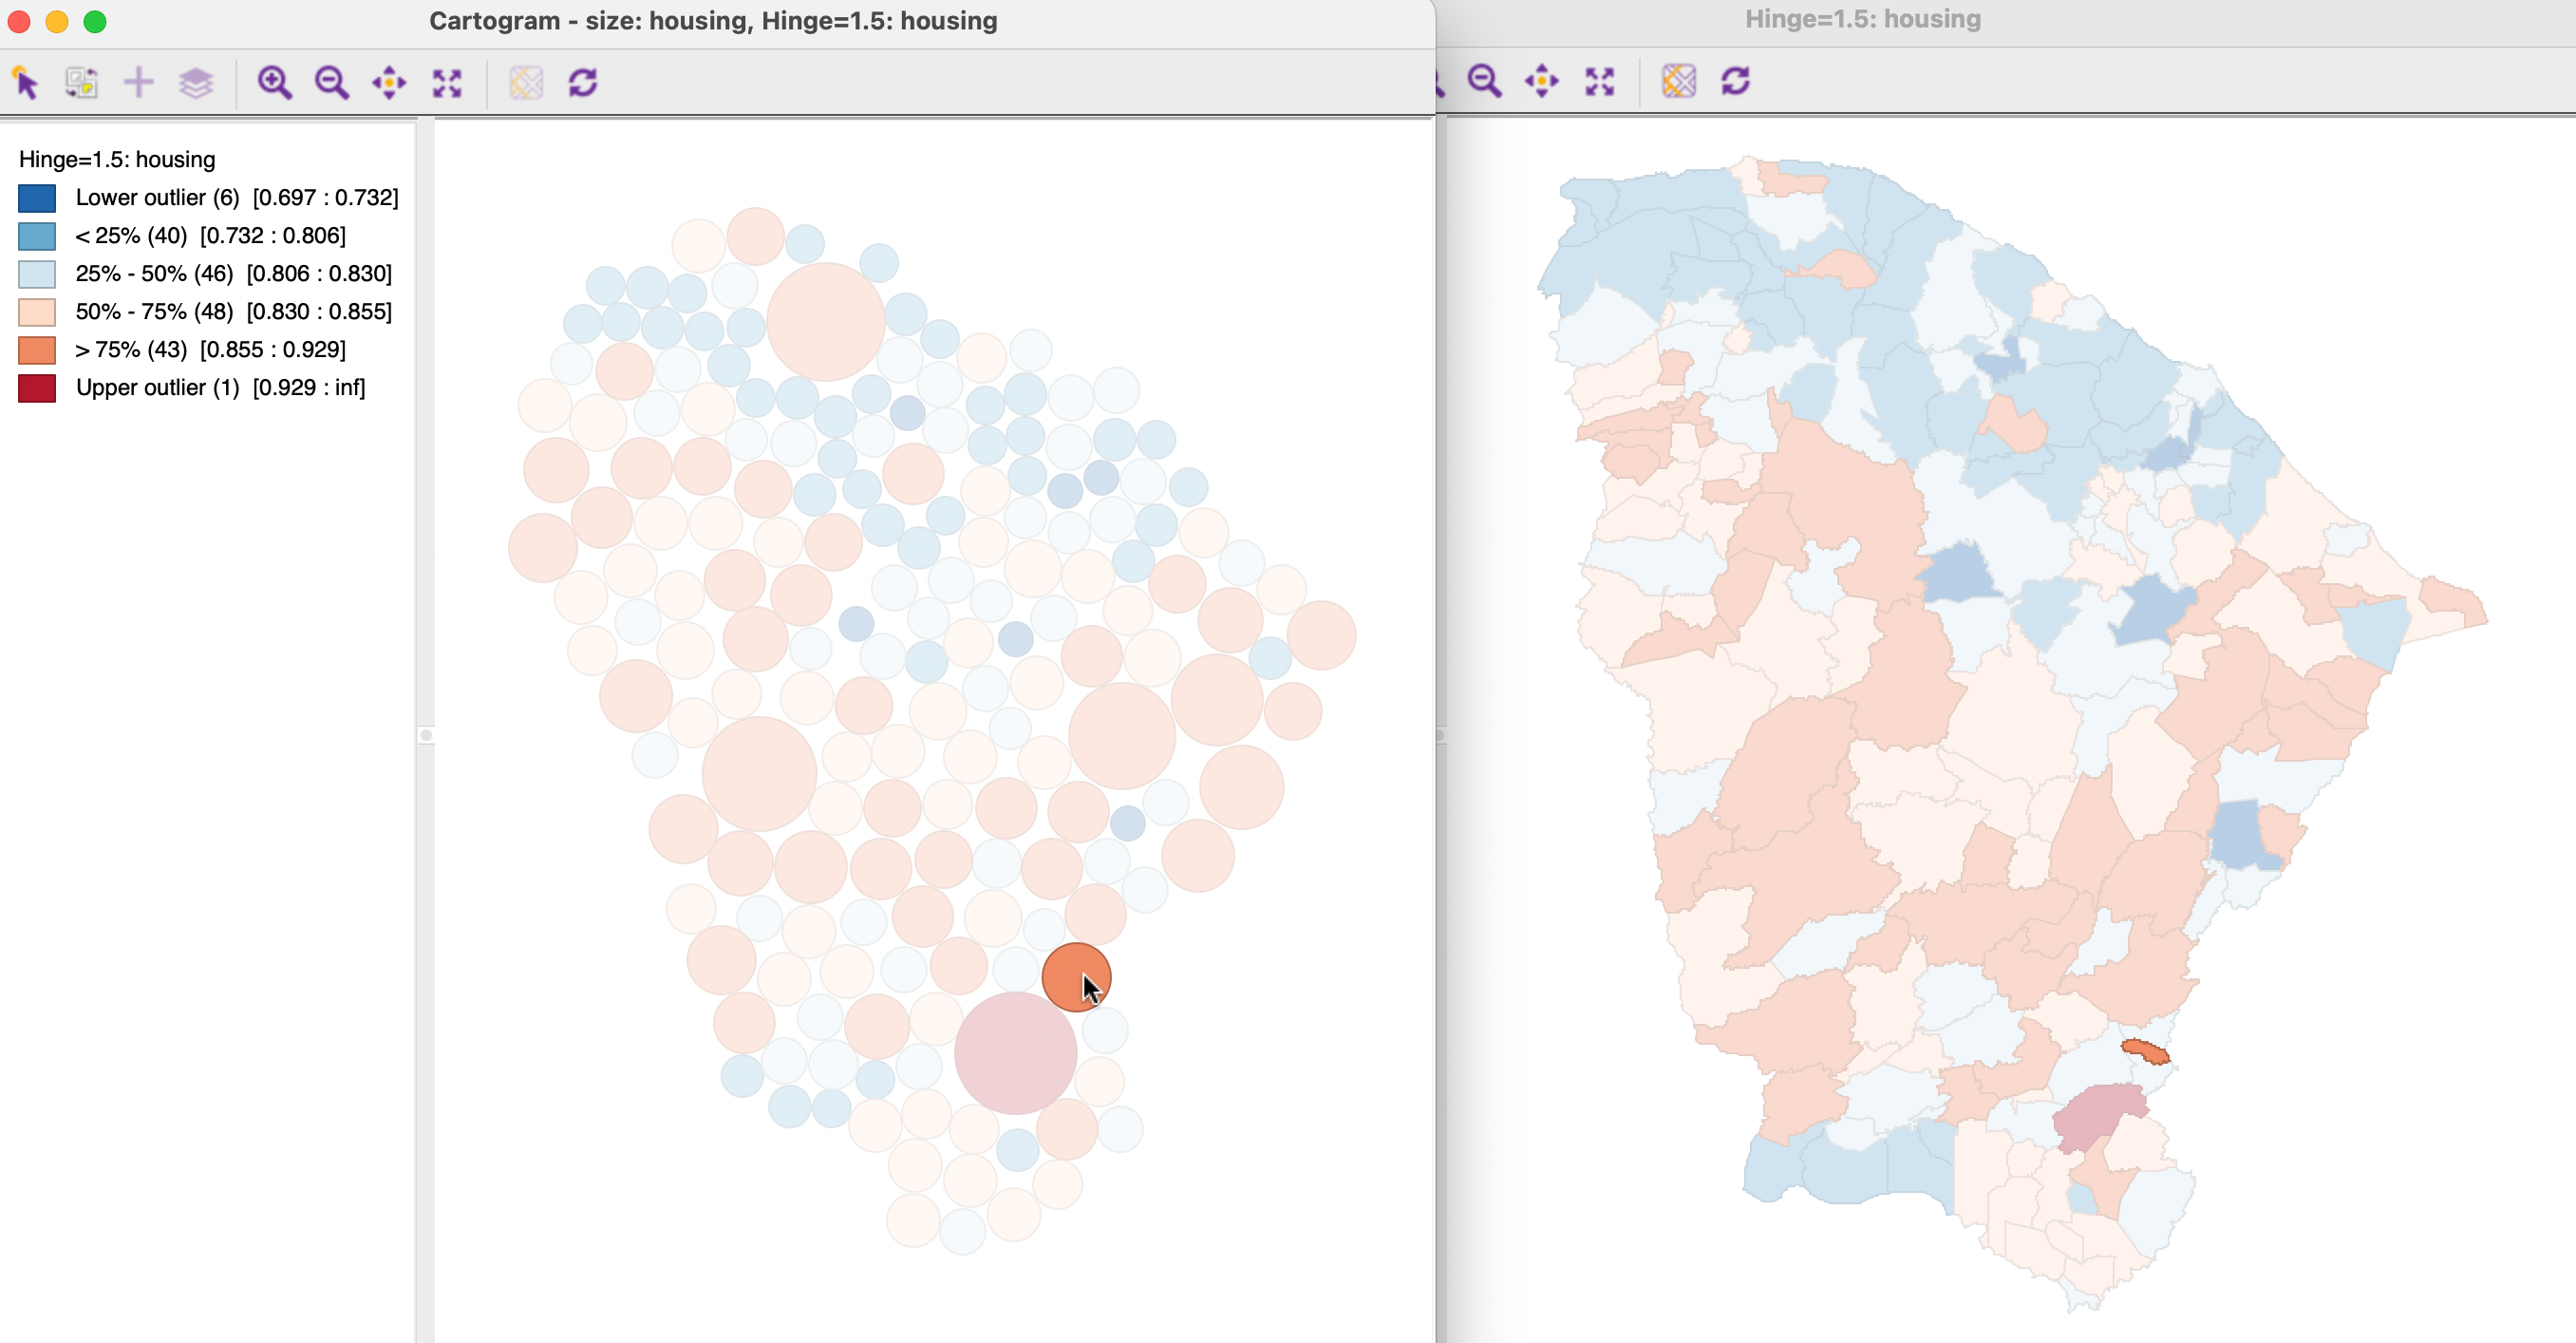
Figure 5.10: Linked Cartogram and map
Except for multi-layer and base map, the cartogram has all the same options as a regular choropleth map, with one addition. The positioning of the circles in the cartogram is the result of a non-linear optimization approach. The algorithm attempts to locate the center of the circle as close as possible to the centroid of the areal unit with which it corresponds, while respecting the contiguity structure as much as possible. As illustrated in Figure 5.10, this is not perfect. There is no unique solution to this problem, and it may be useful to experiment with further iterations that will slightly reposition the circles. This is implemented in the Improve Cartogram option. A number of different iteration options are listed, together with the estimated time. The latter is particularly useful for larger data sets. Each additional set of iterations will result in a slight reshuffling of the circles. In most applications, the initial layout is sufficient for linking and brushing.