16.6 Conditional Local Cluster Maps
A final option for the Local Moran statistic is that the cluster maps can be incorporated in a conditional map view, similar to the conditional maps considered in Section 8.4.3. This is accomplished by selecting the Show As Conditional Map option (the fourth entry in the options menu). The resulting dialog is the same as for the standard conditional map.
In Figure 16.15, the cluster map for access to health care is turned into two micromaps, conditioned by the percentage of the population that speaks an indigenous language on the horizontal axis (p_IND10). An additional variable could be taken into account to condition on the vertical axis, but that is not considered here. The number of intervals (Horizontal Bin Breaks) was changed to two (from the default three), using Natural Breaks as the criterion to determine the cut-off value.
The point of departure is that, in the absence of any interaction effect, the two micromaps should have the same mix of High-High and Low-Low clusters and spatial outliers. In the example, that does not seem to be the case, with a larger share of the Low-Low clusters on the right (i.e., for more indigenous communities), and the bulk of the High-High clusters on the left.
It should be noted that this example is purely illustrative of the functionality available through the conditional cluster map feature, rather than as a substantive interpretation. As always, the main focus is on whether the micromaps suggest different patterns, which would imply an interaction effect with the conditioning variable(s).
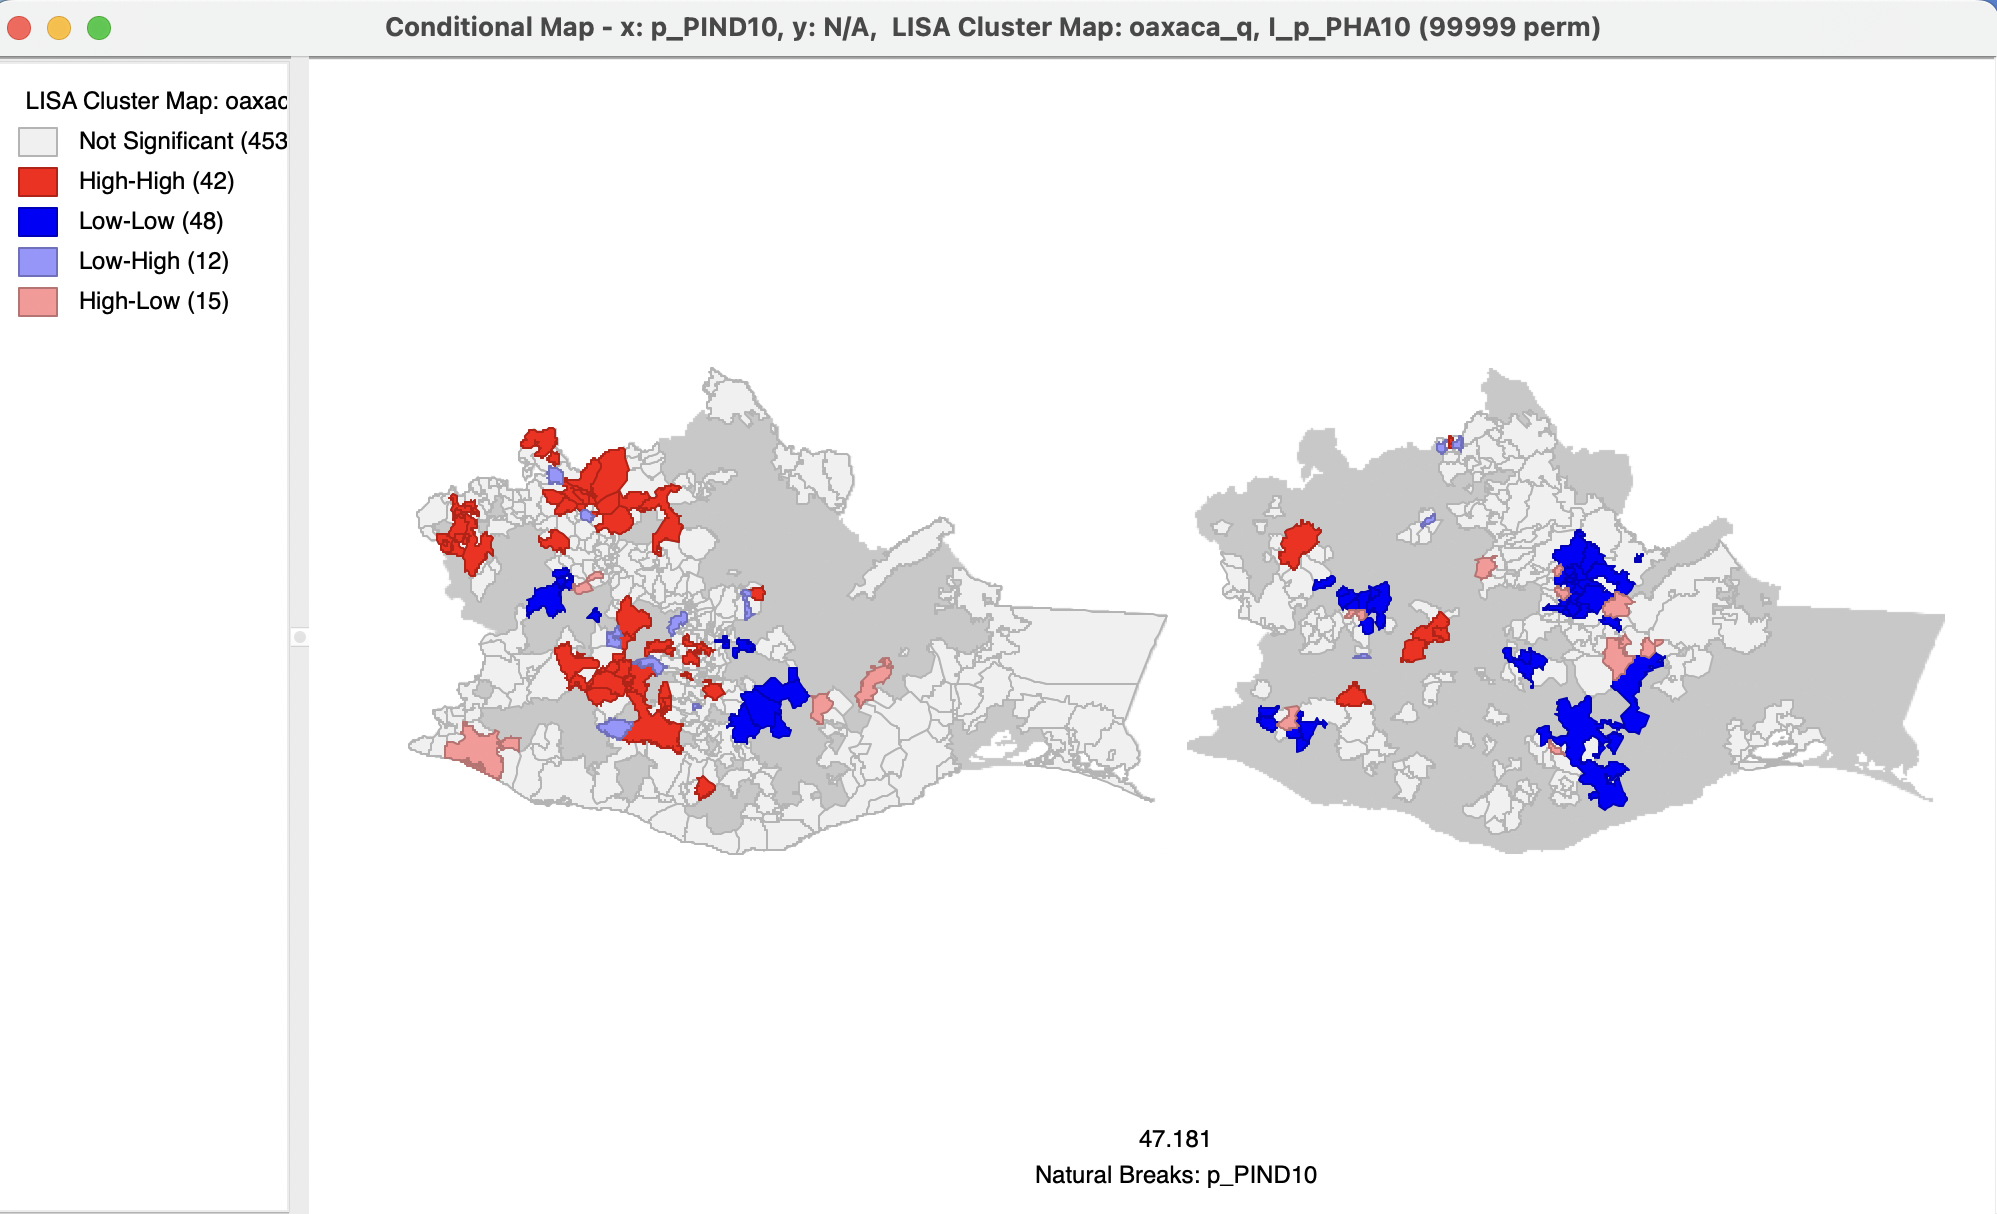
Figure 16.15: Conditional cluster map