7.1 Topics Covered
- Computing descriptive statistics and creating visualizations of the distribution of a single variable (histogram, box plot)
- Interpreting a scatter plot and scatter plot smoothing (LOWESS)
- Linking and brushing maps and statistical graphs
- Analyzing the bivariate relationship for multiple variables in a scatter plot matrix
- Assessing spatial heterogeneity by means of the Averages Chart
- Assessing spatial heterogeneity through the Chow test
- Explore > Histogram
- Choose Intervals option
- Histogram Classification option
- View > Set as Unique Value
- View > Display Statistics option
- Explore > Box Plot
- Hinge option
- Explore > Scatter Plot
- View > Display Precision option
- Data option
- Smoother option
- LOWESS parameters setting
- Regimes Regression option and Chow test
- Explore > Scatter Plot Matrix
- changing the variable order in a scatter plot matrix
- smoothing and brushing the scatter plot matrix
- Explore > Averages Chart
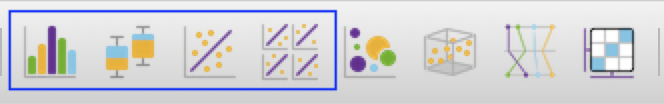
Figure 7.1: Histogram | Box Plot | Scatter Plot | Scatter Plot Matrix