4.5 Comparing Distance Preserving Methods
Traditionally, the fit of a distance preserving dimension reduction method is assessed by means of the objective function used in the algorithm, such as the stress function for MDS or cost for t-SNE. However, such measures are not comparable across methods. Another commonly used metric, the rank correlation between the original inter-observation distances and the corresponding distances in the embedded space is comparable. However, this indicator may be less appropriate for t-SNE, since that method optimizes the match between close observations. In contrast, rank correlation is a global correlation coefficient.
An alternative approach can be based on the concept of common coverage percentage, introduced in Section 3.5.2.2 as a way to measure the overlap between geographical k-nearest neighbors and k-nearest neighbors in the embedded space. It was also used to assess the overlap between different MDS solutions. The common coverage percentage is a simple ratio of the density obtained by the intersection of two k-nearest neighbor graphs to the maximum overlap possible. In the case of k-nearest neighbors, the maximum is \(k/n\), the property listed as % non-zero in the Weights Manager.
In addition to comparing different embedded solutions, this idea can also be applied to obtain an alternative overall measure of the fit of the embedded solution, relative to the k-nearest neighbors in the multivariate attribute space. The maximum coverage is the same, since it is based on the same k for k-nearest neighbors. The only difference with the spatial case is that the reference weights are based on the neighbor structure in multi-attribute variable space. The ratio is then computed of the density of the intersection with the weights for the embedded solution to this maximum.
4.5.1 Comparing t-SNE Options
As was the case for different MDS solutions, it is not straightforward to visually compare the scatter plots that result from manipulating the parameters of the t-SNE algorithm. As before, a solution is to measure the degree of overlap between k-nearest neighbor graphs computed from the scatter plots (i.e., the scatter plot coordinates form the locational information).
For example, comparing the default t-SNE result in Figure 4.4 to the outcome from tuning the momentum and perplexity parameters in Figure 4.9 yields 1.43% non-zero elements in the corresponding k-nearest neighbor graph intersection for k=6. This results in a common coverage percentage of 62.2%. This value is larger than the 46.5% found between classic metric MDS and SMACOF in Section 3.5.2.2.
4.5.2 Local Fit with Common Coverage Percentage
As mentioned, the common coverage percentage logic can be used to compute a local measure of goodness of fit between the embedded space nearest neighbors and the multi-attribute nearest neighbors.
Figure 4.11 shows the results for classic metric MDS (Figure 3.3), SMACOF (using Euclidean distances, Figure 3.8) and default t-SNE (Figure 4.4). The common coverage percentage is computed for values of k equal to 1, 2, 4, 6 and 8, corresponding with increasingly less local neighborhoods. In addition, for the sake of completeness, the rank correlation is listed as well.
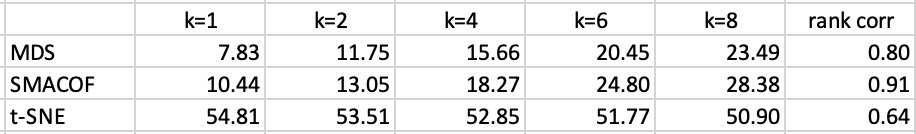
Figure 4.11: Common Coverage Percentage measures of fit for different methods
As we had already seen previously, SMACOF does best on the rank correlation measure, with t-SNE yielding the worst results. In contrast, t-SNE does much better on the measures of local fit. The focus on the local is illustrated by a slightly decreasing coverage percentage, from 54.81% for the nearest neighbor (k=1) to 50.90% for k=8. These percentages indicate more than 50% match between the nearest neighbors. The classic MDS methods do much worse, with SMACOF consistently outperforming metric MDS, but achieving clearly inferior measures of local fit relative to t-SNE. As is to be expected, the common coverage percentage improves with the number of neighbors, almost tripling for SMACOF, from 10.44% for k=1 to 28.38% for k=8.
These findings clearly illustrate the strong focus on local matches inherent in the t-SNE algorithm.