6.4 Cluster Categories as Variables
The cluster categories are saved to the Table as an integer variable. This variable can be used to define categories in a bubble chart or in conditional plots, or, more formally, in an analysis of variance. In addition, it can form the basis of an aggregation or dissolve operation on the original data.
6.4.1 Conditional Box Plot
An intuitive application of the cluster categories is to employ them as the conditioning variable in a conditional graph (see Volume 1). For example, the distribution for the first principal component can be compared among cluster categories in a conditional box plot, as shown in Figure 6.22. In contrast to Figure 6.15, where only the center mean for PC1 is shown for each cluster, the box plot shows the full range of the distribution as well as the mean and median in each cluster. The relative positions of the mean (green dot) match the pattern on the parallel coordinate plot for the mean centers. Taking the interquartile range into account suggests worse economic conditions in clusters 1, 2 and 6, whereas clusters 4 and 7 are clearly at the opposite end of the spectrum.
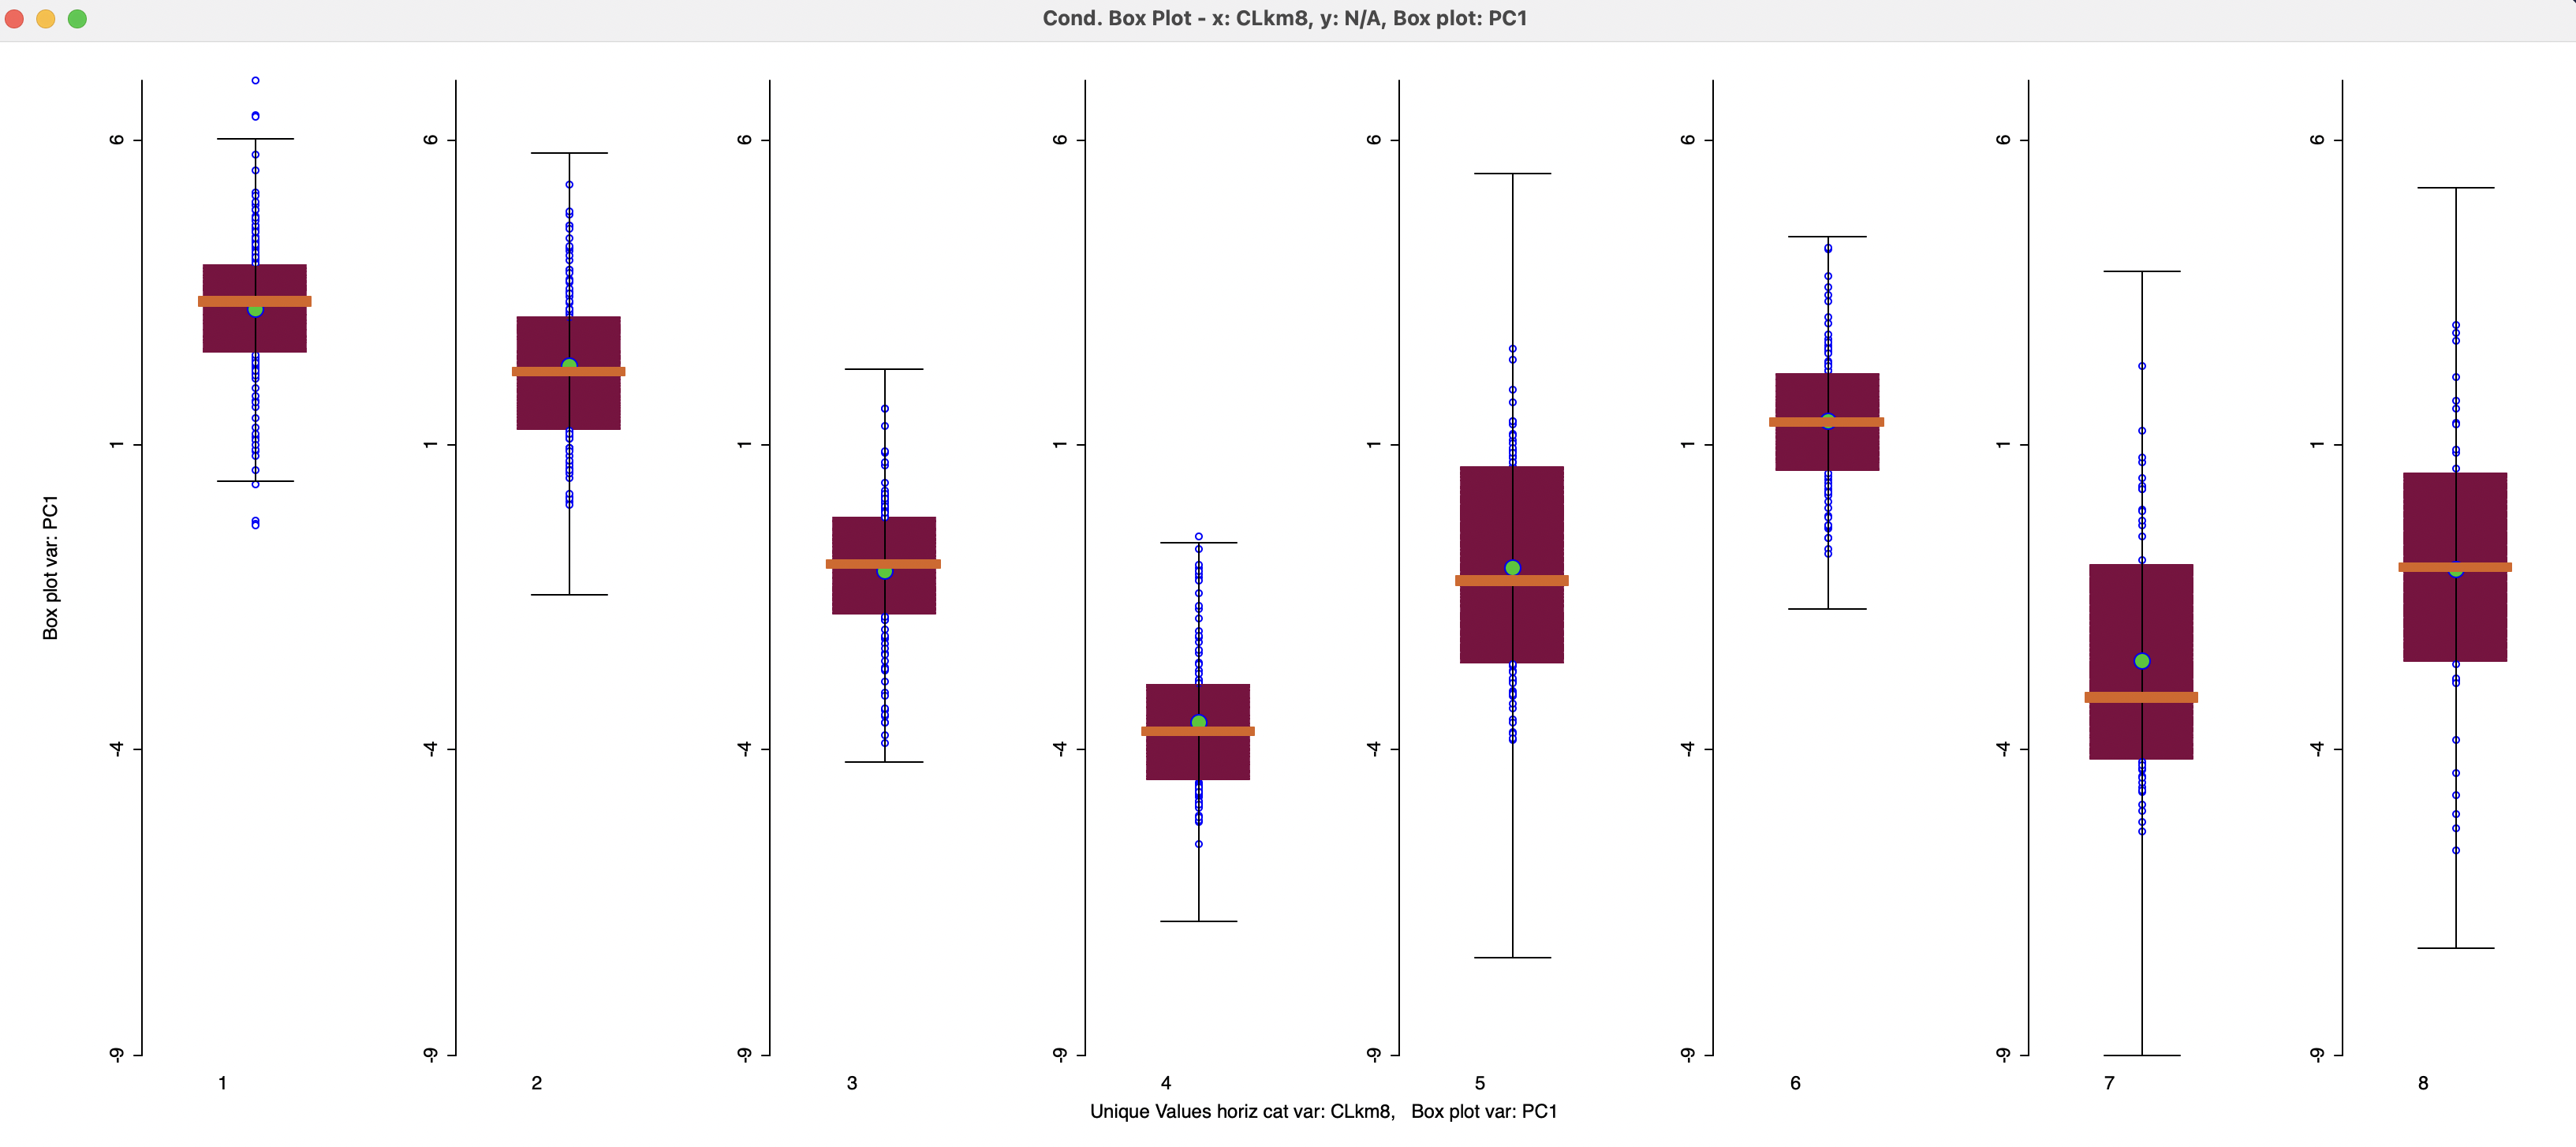
Figure 6.22: Conditional Box Plot by Cluster Category
6.4.2 Aggregation by Cluster
The cluster category can also be used to create a new set of observations at the cluster scale. This can be done through simple aggregation or by means of the GIS dissolve operation (covered in detail in Chapter 3 of Volume 1). Whereas the former only results in a new data table, the latter yields a new spatial layer.
It is important to keep in mind what operation is used to compute the aggregated values. For spatially extensive variables, a simple sum is appropriate, but for other variables this is not the case.
The dissolve operation is illustrated in Figure 6.23. This shows essentially the same pattern as the cluster map, but the tract boundaries have been removed and only the spatial definition of the clusters remains.
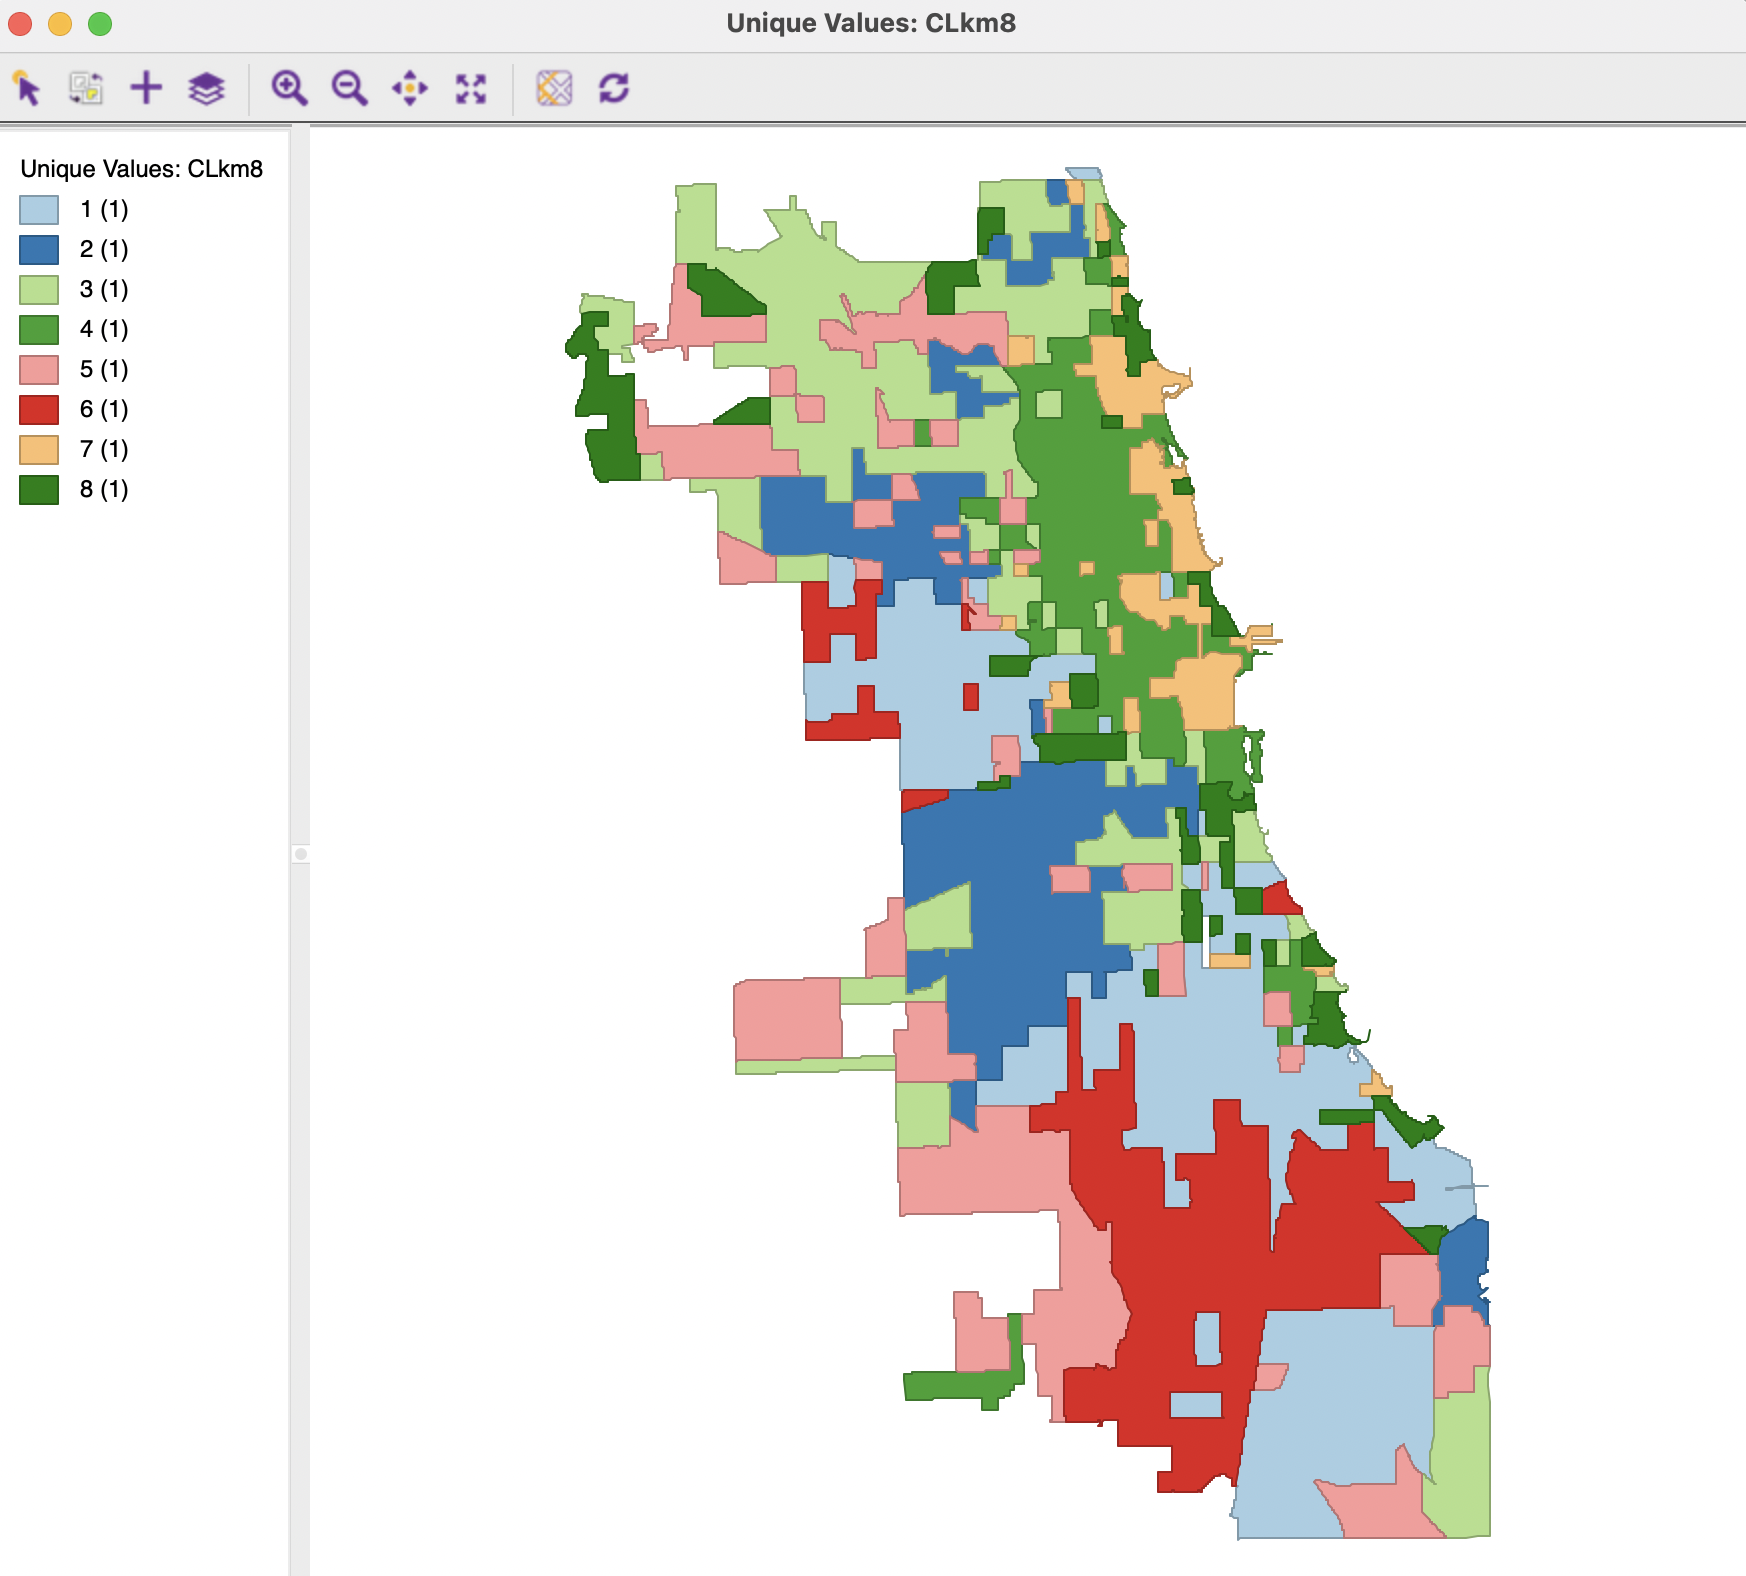
Figure 6.23: Dissolved Cluster Categories
The associated data table, for a Sum operation on the Pop2014 variable is shown in Figure 6.24. The table includes the cluster label, the number of census tracts contained in each cluster (AGG_COUNT) and the total population of each cluster. The table reveals that clusters 7 (population 213,285) and 8 (population 122,842) do not meet the default minimum bounds population criterion of 271,050, thus confirming that the latter is too high to obtain a constrained solution.
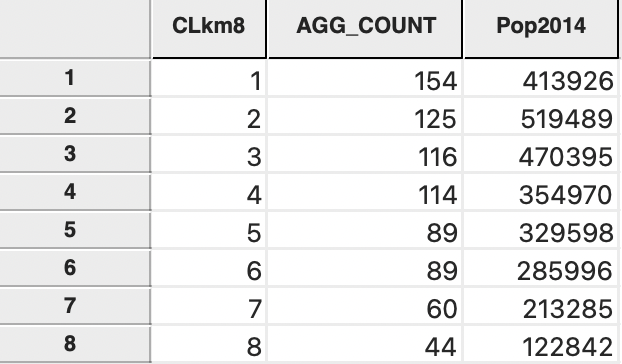
Figure 6.24: Aggregated Cluster Categories
The same table is obtained when the aggregation operation is carried out without the spatial dissolve.